
Ptree connects biological records that were published with different names, units, vocabularies, and taxonomic boundaries. Its contribution is the interpretation that makes those records comparable, the evidence retained behind that interpretation, and the ability to explore the result across scientific trees.
Scientific classifications and identity
Ptree presents 11 scientific trees, including taxonomic catalogs, evolutionary trees, genomic classifications, and fossil records. Each retains its own hierarchy. The shared identity index connects records about the same organism or group across providers using identifiers, names, and taxonomic context.
Switching trees takes you to the corresponding organism or branch, carrying its properties, images, and evidence with it. When an exact counterpart is absent, Ptree uses both ancestors and descendants to locate a comparable position. The trees can disagree about a group's membership; those differences remain visible in its descendants and summaries. A group one tree doesn’t draw is still linked where a value came from it: the link opens the group in a tree that has it.
Biological properties and vocabulary
The reference currently exposes 42 properties: 24 categorical and 18 numerical, with more to come. A property is defined by the biological question it answers. Organism mass is distinct from offspring mass; a tolerated temperature range is distinct from an optimum. Units, life stage, anatomical referent, and the scope of a record determine whether evidence can be combined.
Categorical properties require an explicit interpretation of specialist terminology. Nutrition interprets 222 source terms from 49 sources, admitting 201 into nine feeding categories. Setting interprets 1,407 terms, admitting 1,143 into seven environments. A term can contribute to several categories when the biology supports it. Descriptions that do not establish a category are excluded explicitly, and unfamiliar terminology is flagged for review.
The full Nutrition vocabulary diagram traces every term behind those counts. A single property can draw on 82 sources, and up to 12 can contribute to one property value.

One description can answer seven questions
Kew’s World Checklist of Vascular Plants records the orchid Agrostophyllum arabukanum (record 519757) as an “epiphytic rhizomatous subshrub.” The source describes one plant in one field. Ptree reads three grammatical facts and projects them into nine categories of seven properties. It is the first row of the atlas below.
Decomposition separates substrate, storage organ, and base life form. Normalization recognizes “rhizomatous” as the rhizome fact. Interpretation decides what that fact establishes for a particular question: here, clonal Organization and asexual Reproduction. “Subshrub” answers Growth form, perennial Persistence, branched Shape, and repeated Reproduction. “Epiphytic” answers Setting and Position, but contributes no parasitic Nutrition claim: sharing a host environment does not establish how nutrients are obtained.
These contributions remain connected to their common origin. A source description used by seven properties has not become seven independent observations. Conversely, AusTraits’ plant_growth_substrate term “epiphyte” can answer the same Setting and Position questions through its own evidence path. Original wording, source, and scope survive both the branching and the convergence.
Different sources require different grammars
A whitespace-separated list, an ordered fossil description, and a hierarchical isolation path cannot be interpreted by one bag-of-keywords rule. Source grammar identifies the facts; each property decides which facts answer its question. The following atlas shows the intermediate steps for eight sources and every property their phrases reach.
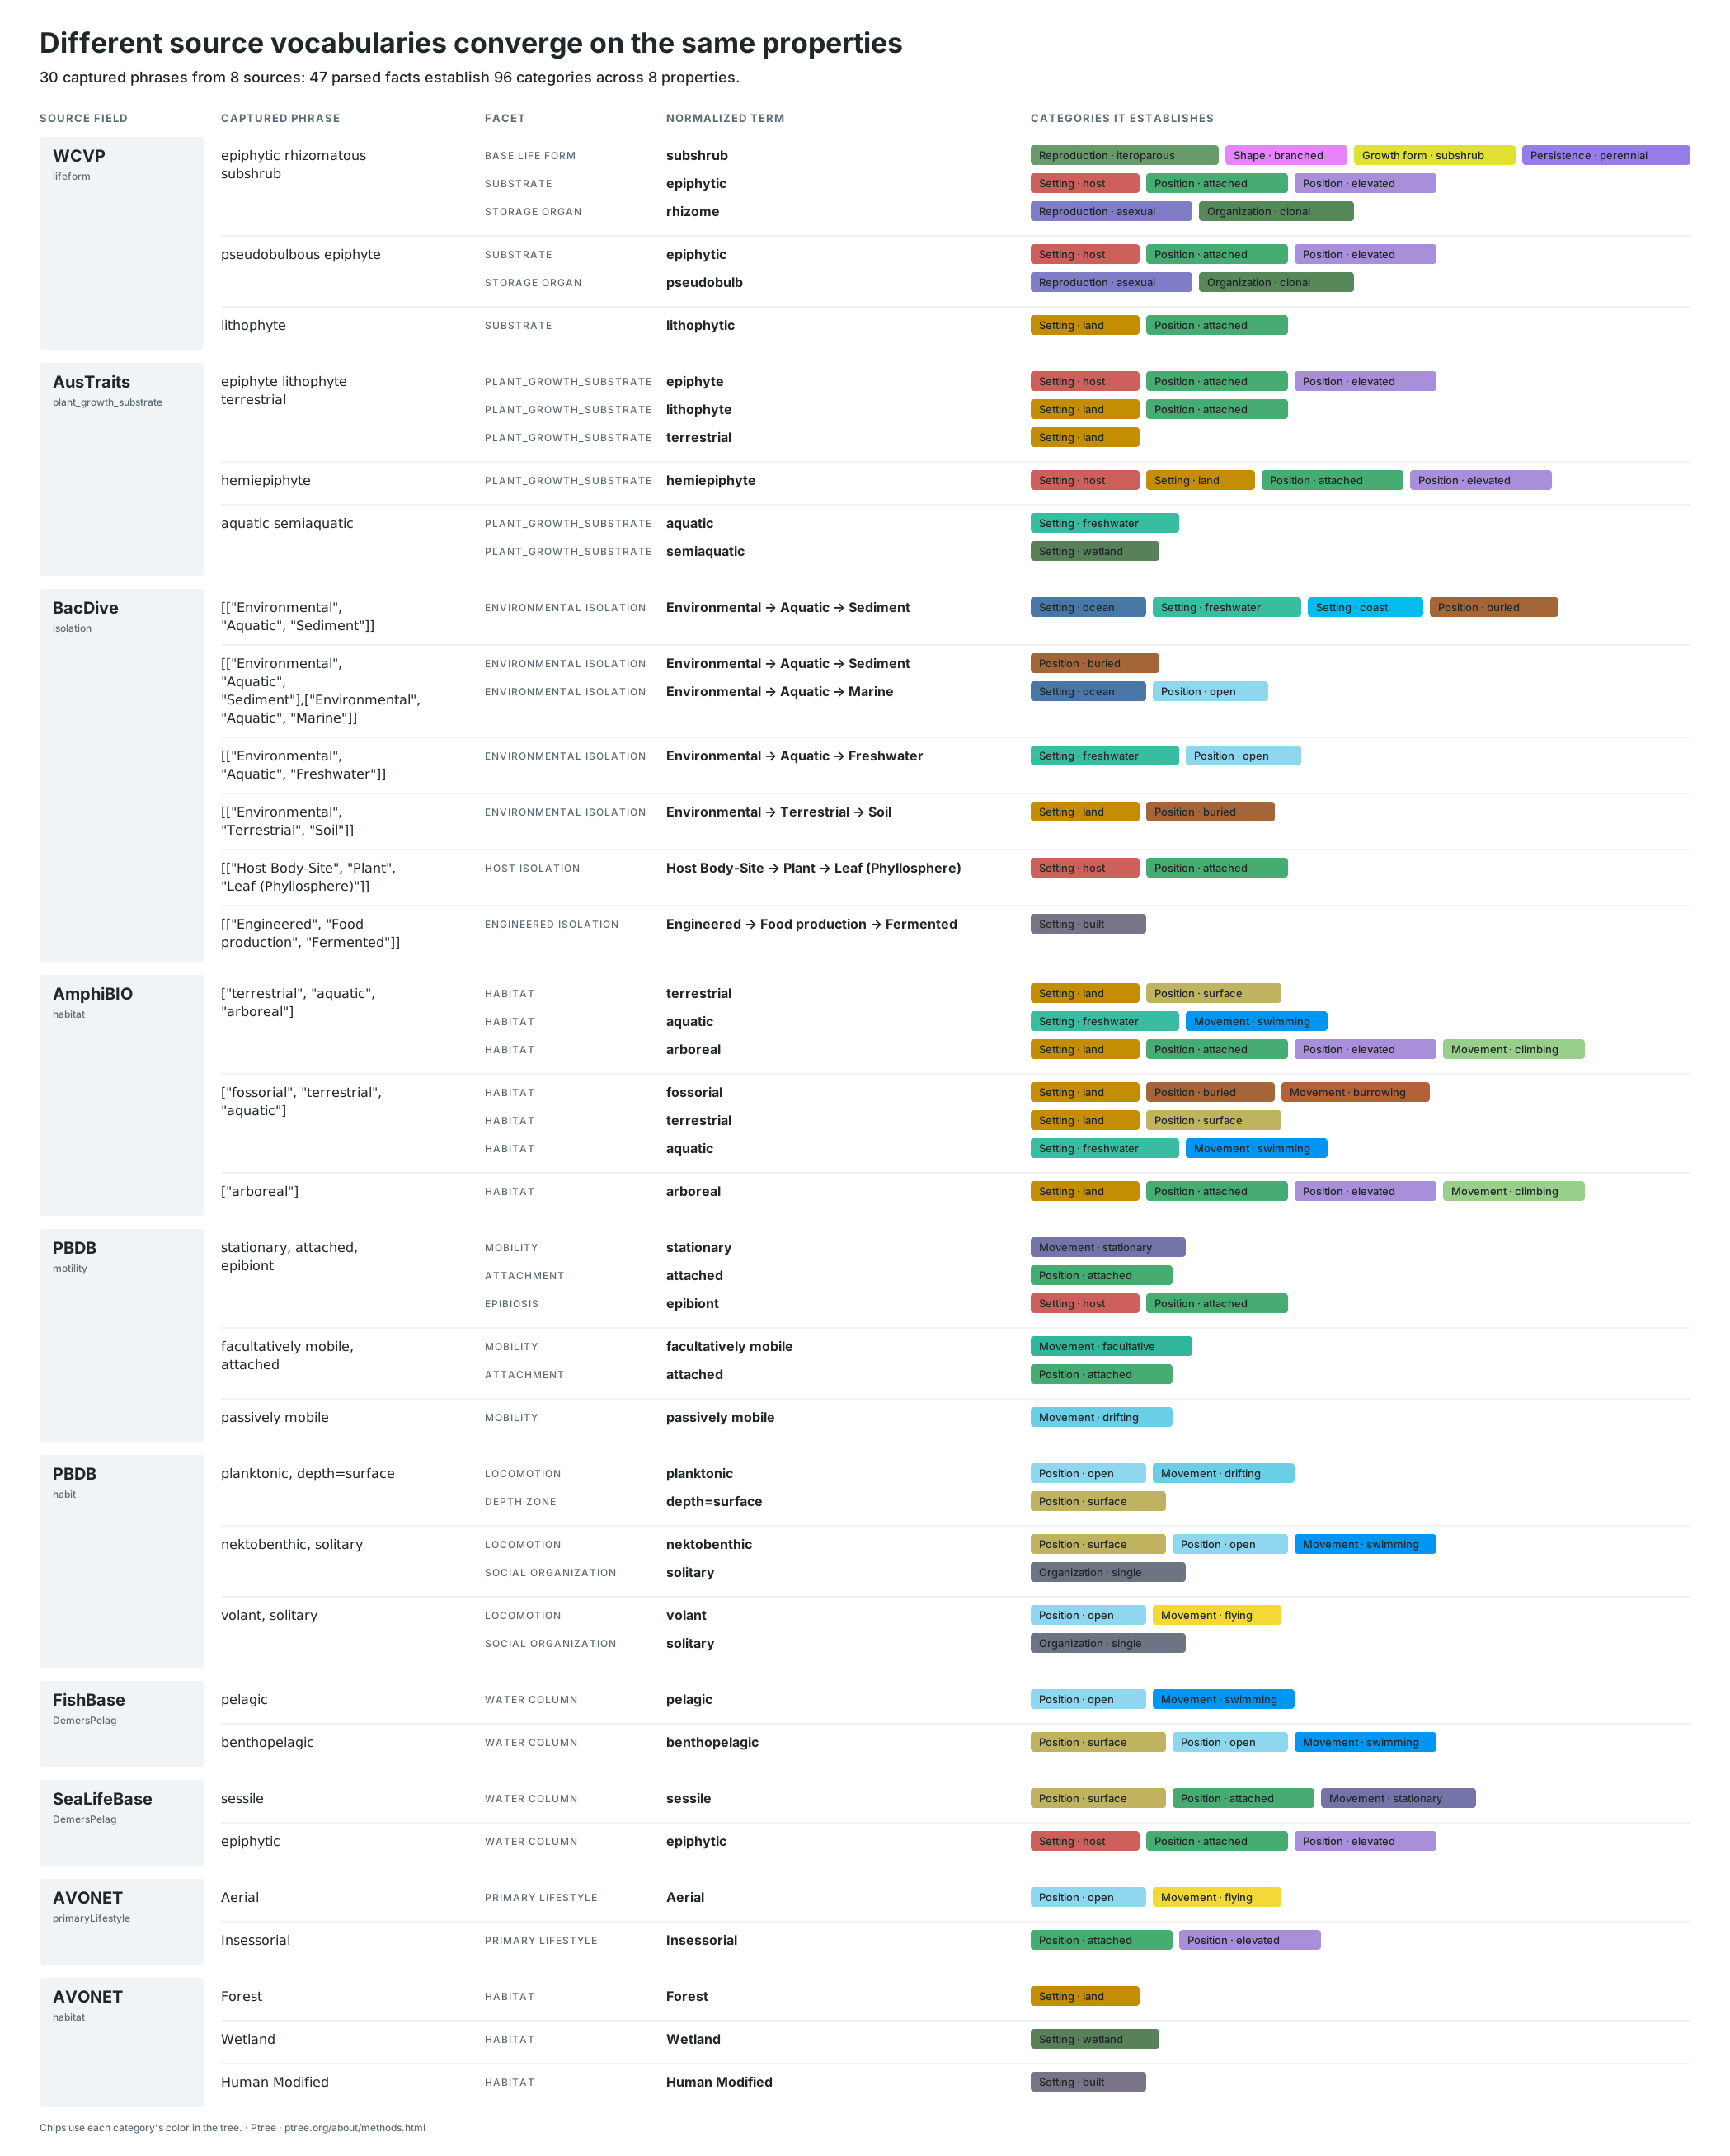
- AusTraits: “epiphyte lithophyte terrestrial”
- Three substrate terms coexist. Epiphyte supplies host Setting and attached, elevated Position; lithophyte supplies land Setting and attached Position; terrestrial also supplies land Setting. Repeated support for land or attachment within the same authority does not create additional independent votes.
- PBDB: “stationary, attached, epibiont”
- The ordered clauses name mobility, attachment, and epibiosis. Stationary answers Movement; attached answers Position; epibiont answers both host Setting and attached Position. A fossil catalog’s single motility field therefore contains evidence for three different questions.
- BacDive: Environmental → Aquatic → Sediment
- The path establishes buried Position. It supplies no salinity distinction, so Setting holds ocean, freshwater, and coast together. Where the same strain record adds Environmental → Aquatic → Marine, that path answers Setting alone, and Sediment keeps only its buried Position.
An inference keeps its original premise
FishBase’s “pelagic,” AVONET’s “Aerial” and PBDB’s “planktonic” all reach Position’s open category. Their Movement interpretations are swimming, flying, and drifting respectively. Once the terms have been compressed into “open,” that distinction is lost. Ptree therefore interprets the original source fact in its biological context; it does not use a displayed category as a universal premise for another property.
The same boundary matters for parasitism: a plant’s attachment to its host does not establish surface attachment for every parasitic animal. Source-specific implications stay with their supporting facts and taxonomic context. Explicitly recorded entailments carry a basis; some existing source interpretations still retain authored delivery, so the provenance review distinguishes an interpretation’s biological validity from whether its delivery label yet describes that step fully.
Units are only the beginning of normalization
Two values become comparable only after their units, organism or organ, life stage, measurement role, and authority agree. The normalization retains those distinctions rather than letting the shared unit erase them.
- Count → reciprocal → mass
- A source reporting seeds per pound supplies a count density. One seed’s mass is 453.59237 ÷ seeds-per-pound grams. The result enters Offspring mass with its count-derived basis. It does not become an adult organism’s Mass. Eggs, seeds, and newborns can answer the same offspring question while retaining their exact life-stage words.
- Adult mean → maximum → reconstruction
- Mass evidence has a biological preference order. Adult or species means precede less comparable measurements; a reported maximum can fill an otherwise missing organism. Reconstructed fossil mass and inferred species means remain useful, explicitly identified evidence. Wet, dry, carbon-derived, and above-ground biomass retain their different bases.
- Sex-specific ages stay sex-specific
- The Amniote green-turtle record reports an unspecified maturity age of 14,610 days alongside male and female values of 3,650 days. Ptree uses the sex-specific evidence instead of mixing all three into a fictitious average. One known sex gives a point; two provide the sex-spanning range. Repeated observations of one sex cannot manufacture the other endpoint.
- A bound is not an observation at its midpoint
- Longevity can arrive as a maximum, a lower-only lifespan class, a closed interval, or a central measurement. Each keeps its role. A maximum-only record contributes an upper bound; it does not invent a lower bound, a mean, or a lifespan of zero. Group distributions retain this incomplete but useful evidence.
- One measurement can support another question
- A positive mammalian weaning age supplies a numerical juvenile-development endpoint and supports an entailed maternal-provisioning claim in Parental care. The duration remains a duration; the care claim names its weaning basis. Gestation evidence can similarly support internal reproduction without consuming or replacing the measured duration.
- Similar names can hide different denominators
- Gas exchange keeps conductance and water efficiency as separate coordinates. Instantaneous efficiency divides assimilation by transpiration; intrinsic efficiency divides assimilation by stomatal conductance. In the paired direct observations examined during the trait audit, those two efficiency measures correlated at only 0.043. Their shared “water-use efficiency” name does not make them interchangeable.
When a predicted curve runs backwards
The captured TreeTraits table contains 55,779 complete triples for hydraulic thresholds P12, P50, and P88: the pressures associated with losing 12%, 50%, and 88% of water transport. 17,092 triples—30.64%—cross their required physical order. The independently imputed coordinates can each look plausible while making an impossible envelope together. Ptree orders the modeled display envelope and retains the original predictions with their original roles in the evidence trace. That adjustment does not turn predictions into measured curves.
A complete directly measured stem curve takes precedence. If only a direct threshold is available, it remains a named point; Ptree does not splice it into two modeled endpoints and call the result an observed curve. The TreeTraits publication discusses the crossing predictions as a model limitation; the 17,092 count is Ptree’s audit of its captured table.
Evidence, scope, and independent sources
Captured source records are retained alongside their normalized values. Evidence records distinguish reported observations, published estimates, and biological inferences, together with the organism or broader group to which they apply. The viewer exposes source terms, citations, and qualifications behind the displayed properties.
One original authority can reach Ptree through several databases. Those repeated deliveries are identified before evidence is combined, so copies of one source do not become independent corroboration. Some facts have a single authority: conservation status is GBIF’s copy of the IUCN Red List, and Wikidata fills it only where GBIF has none. A broad taxonomic inference remains distinguishable from a direct species record, and more specific evidence can override it.
Ptree tracks errors in its upstream sources with a record of the entries that show each one and how it is handled.
Leaf economy makes the distinction concrete: direct AusTraits measurements take precedence over direct TraitBank evidence, followed by modeled TreeTraits values where measurements are absent. Repeated observations first combine within their originating authority; the remaining authorities then receive equal weight. An aggregator’s copy of TRY evidence and a model trained largely from TRY cannot be treated as two new independent experiments.
Missing answers have different causes. An unfamiliar term needs vocabulary review. A recognized term such as “clear water” can lack the distinction one property requires: clarity says nothing of salinity. A captured detail can lie outside the current questions. A useful phenotype can also remain withheld because its taxonomic identity is unresolved. These conditions retain their evidence and reasons; none means the organism lacks the trait.
How a value reaches a species
Most species have no record of their own for most properties. Ptree gives such a species a value in one of four ways. Under each value in its sources, the line marked “basis” says which way, whether the source or Ptree did it, and from which group.
Recorded. A source states the value for this species, or states the range of values a group’s members span.
Inherited. A source states what a group’s members normally have, as PBDB says crocodilians are carnivores. A member with no record of its own takes that default. Sometimes the source’s own hierarchy hands it down, and the basis reads “inherited by the source”; otherwise Ptree follows its trees, and it reads “inherited by Ptree.” Ptree hands a default down only where every tree holding the species leads to the same value, and a described member passes it on to its own members only where its description agrees. The species then reads “by default” in its properties.
Inferred. A default from far above can be wrong for a whole family, so before it reaches a family Ptree looks at the family’s described species. If most of them, from at least two genera, give answers the default doesn’t allow, it stops at the family, and the answer most of them give goes to the family’s species that have no record. Those species read “likely.” Say a source calls Carnivora carnivorous and says nothing about Felidae: if the house cat and the cheetah were described as herbivores, an undescribed lion would read “likely herbivorous.” Two species from one genus are not enough, since a genus is often recorded precisely because it differs from its relatives. Tested on well-described families with their records held back, two species from two genera stopped a wrong default correctly 97% of the time. The check is made at the family and nowhere above it, because above a family a source’s records tend to be the exceptions it chose to note, such as a group’s few climbers. Where no answer holds most of the family, its undescribed species stay unknown.
Implied. Some values follow from another fact. A species native to a single region is endemic, an organism with recorded hosts lives on or in another organism, and a mammal feeds its young. Values Ptree calculates, such as a cell’s volume from its measured dimensions, are marked the same way.
A species’ own record always outweighs anything handed down to it, and an inherited value never counts in a family’s check. A use or a trade listing describes people’s relation to an organism rather than the organism itself, so it takes no family answer.
Group summaries and coverage
Categorical summaries show the mixture of traits among the descendants represented by the data. Numerical summaries preserve variation through distributions, including medians, quartiles, and whiskers where the property calls for them. They describe the available evidence within the selected tree's group.
A group’s properties name the leading answer among its members with data: all when every one of them shares it, almost all at 90% or more, mostly above half, and most often when the leading answer is more than twice the next. Otherwise the leading answers are named together.
Coverage is part of the display. Missing evidence leaves a tile uncolored, and sparse evidence reduces color strength, so an uncolored tile means no source said anything, never a low value. A small numerical value still has its own place on the scale. Including deep-time fossils changes both group membership and the evidence entering its summaries.
Images, recordings, and ecological relationships
Ptree assembles photographs from multiple sources and scores their metadata to select representative images. Identification agreement, annotations, and curation help guide selection. Photographer credits and image licenses remain attached. Silhouettes retain their artist credits and individual terms. A group shows one of its descendants’ photos and names the species pictured.
Recordings come from xeno-canto and iNaturalist and are chosen the same way, one per species, with no source preferred. A sound classifier listens to each candidate, a recording in which the animal is measured is preferred over one known only by its grade, and playback starts where the animal is first heard. A group plays its best-recorded descendant and names it.
Ecological links retain their contributing sources through Global Biotic Interactions. A recorded feeding, host, or pollination relationship provides another route between organisms; multiple records can describe the same relationship. Range maps and encyclopedia articles retain their source attributions.
Corrections
To report a problem, contact Michael Dayah with the full Ptree URL, the property or relationship involved, and the source record or publication supporting the correction. The full URL preserves the scientific tree and exploration state needed to locate the result.
Sources and licenses identify the data providers. Citing Ptree explains how to reference the explorer and the underlying evidence. The revision history dates each change to these methods.